Why your PMax ROAS can rise while revenue falls
Performance Max can look exceptional inside Google Ads while total business revenue softens. The gap is often explained by attribution, channel allocation and demand that already existed.
If Google Ads says Performance Max is producing more conversion value, but first-party revenue is moving in the opposite direction, the campaign-level number is not the conclusion. It is the start of the investigation.
The number that matters sits outside Google Ads
PMax can capture branded searches, repeat visitors and remarketing demand, then report the resulting sales as campaign performance. Those conversions may be valid, but they are not automatically incremental. Some would have happened through brand search, direct, email or organic traffic without PMax touching them.
This is why a rising campaign ROAS can coexist with falling revenue. Google is getting better at claiming demand while the business is generating less of it.
If reported conversion value rises, did total first-party revenue rise with it—and did it rise by enough to justify the extra cost?
The stone tiles example
Imagine two campaigns running side by side for stone tiles. A standard Shopping campaign keeps product traffic inside Shopping. A PMax campaign receives a £100 daily budget, but its cross-channel report shows only £16 reaching Shopping on a given day. The balance can move into Search, Display, Video, Discover, Maps or Gmail according to Google’s automation.
PMax may still report the stronger ROAS because it can retarget existing visitors and intercept branded demand. Meanwhile, the product-led channel that had been producing the strongest new-customer signal receives a smaller share of the budget.
| Measure | What it tells you | What it does not prove |
|---|---|---|
| Attributed revenue | Value credited to the campaign | That the campaign created the demand |
| Campaign ROAS | Credited value divided by ad spend | Incremental profit or business growth |
| First-party revenue | What the business actually took | Which channel deserves all the credit |
| Blended cost of sale | Total media cost against total revenue | Why performance changed |
PMax decides where the budget goes
The practical issue is control. Advertisers cannot set a fixed percentage of a PMax budget for Shopping. The system chooses the mix according to predicted conversion value, and that prediction is shaped by the conversion data and attribution model it can observe.
That makes the channel split a governance issue, not simply a reporting curiosity. If Shopping is the strongest route to genuinely new demand, allowing it to be quietly displaced can weaken the wider commercial outcome.
The report that exposes the shift
In Google Ads, open the PMax campaign and navigate to Insights and reports, then Channel performance. Set the date range and segment the view by day. Compare cost, conversions and conversion value across Shopping, Search, Display, Video and other eligible inventory.
Interface wording can change, and the report is directional rather than a complete incrementality study. Its value is that it makes channel reallocation visible.
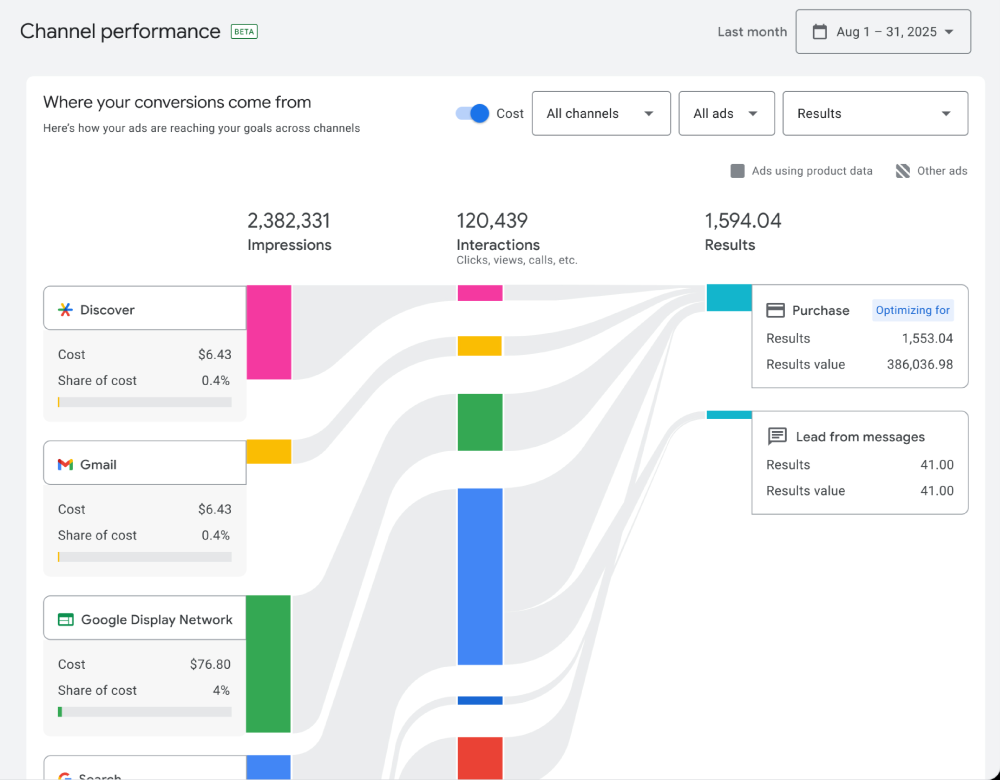
Open channel performance
Select the PMax campaign, then use Insights and reports to reach the cross-channel view.
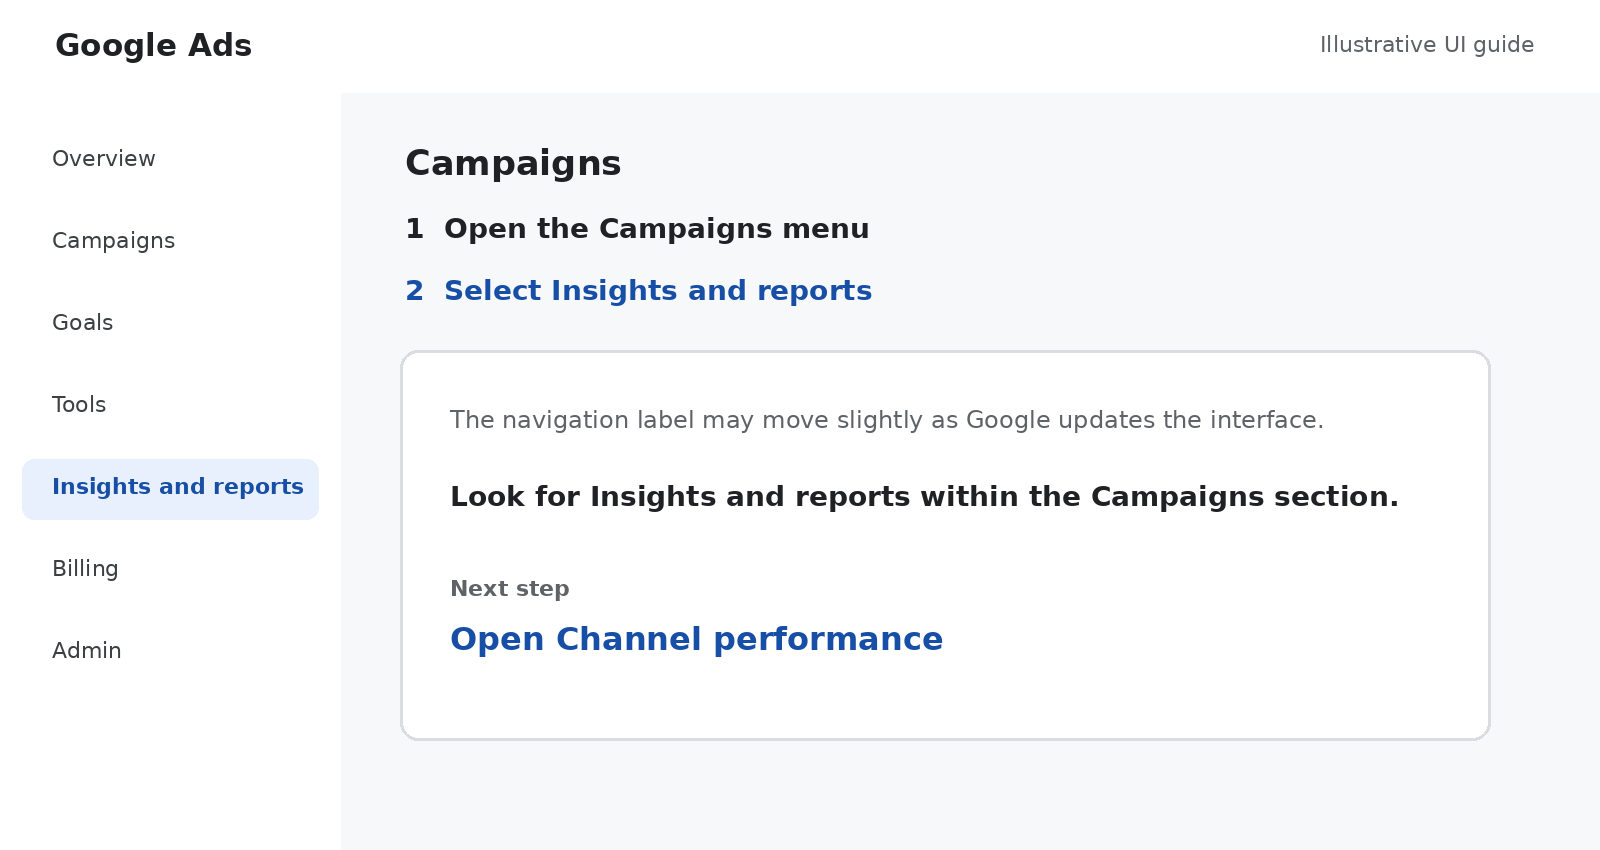
Break the evidence down by day
Compare cost and conversion value by channel against first-party revenue for the same period.
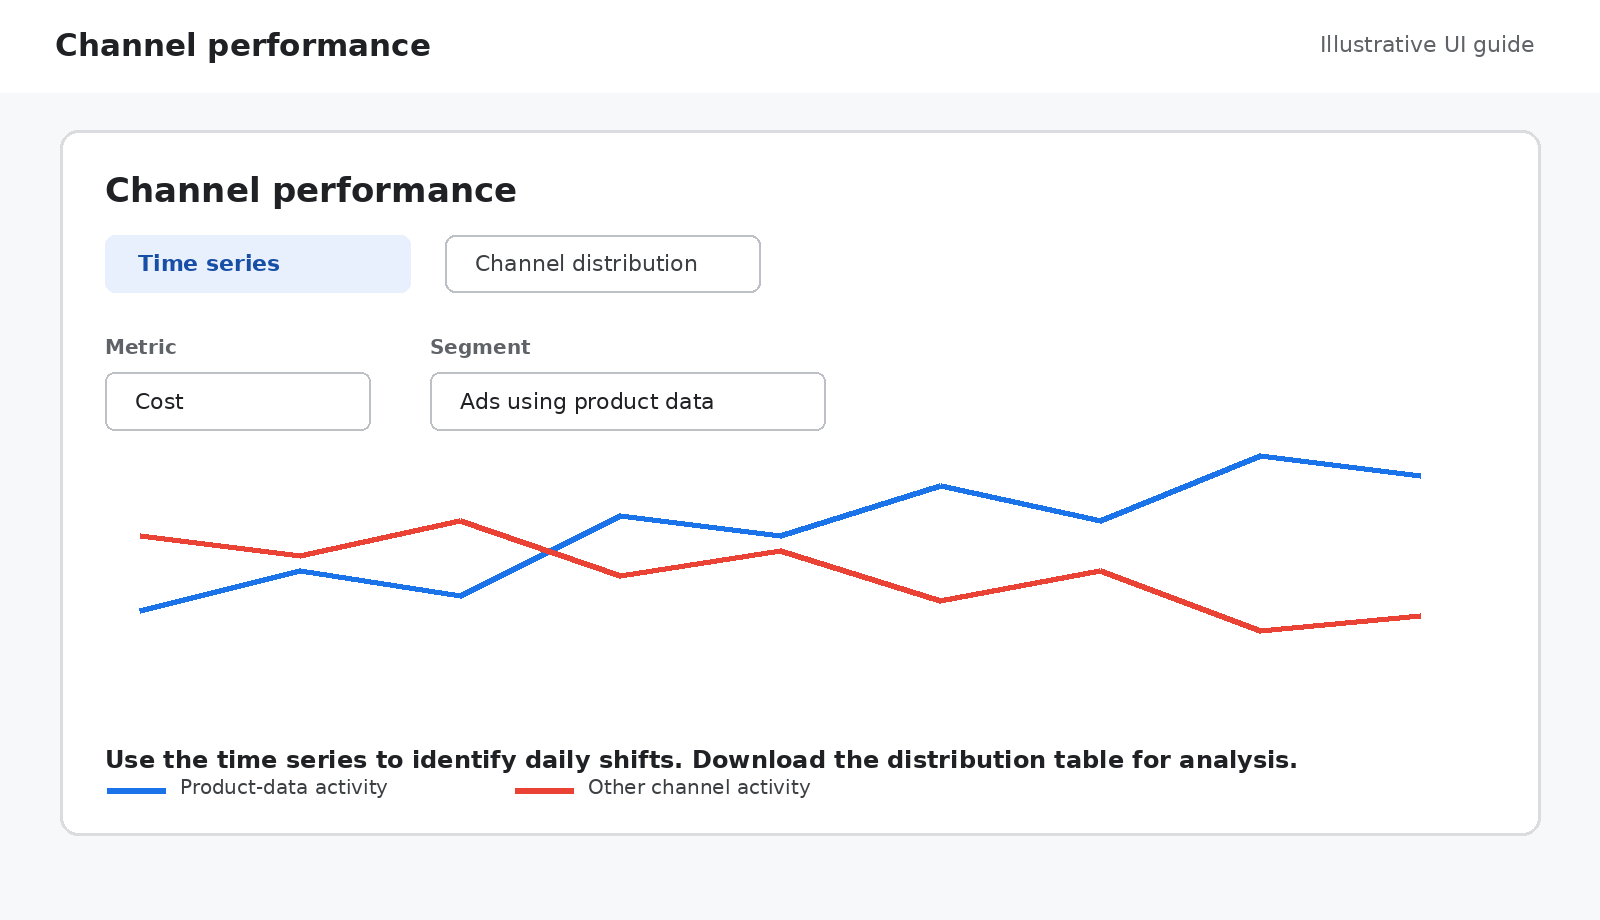
What to compare day by day
Export daily channel data and place it beside revenue from the ecommerce platform or finance system. Track Shopping’s share of PMax spend, branded search volume, new-customer revenue, blended cost of sale and total revenue. You are looking for a repeated relationship, not a single dramatic day.
- Does Shopping spend fall as PMax reported conversion value rises?
- Does more value come from branded or returning demand?
- Does total first-party revenue rise, remain flat or decline?
- Does the blended cost of sale improve after all media cost is included?
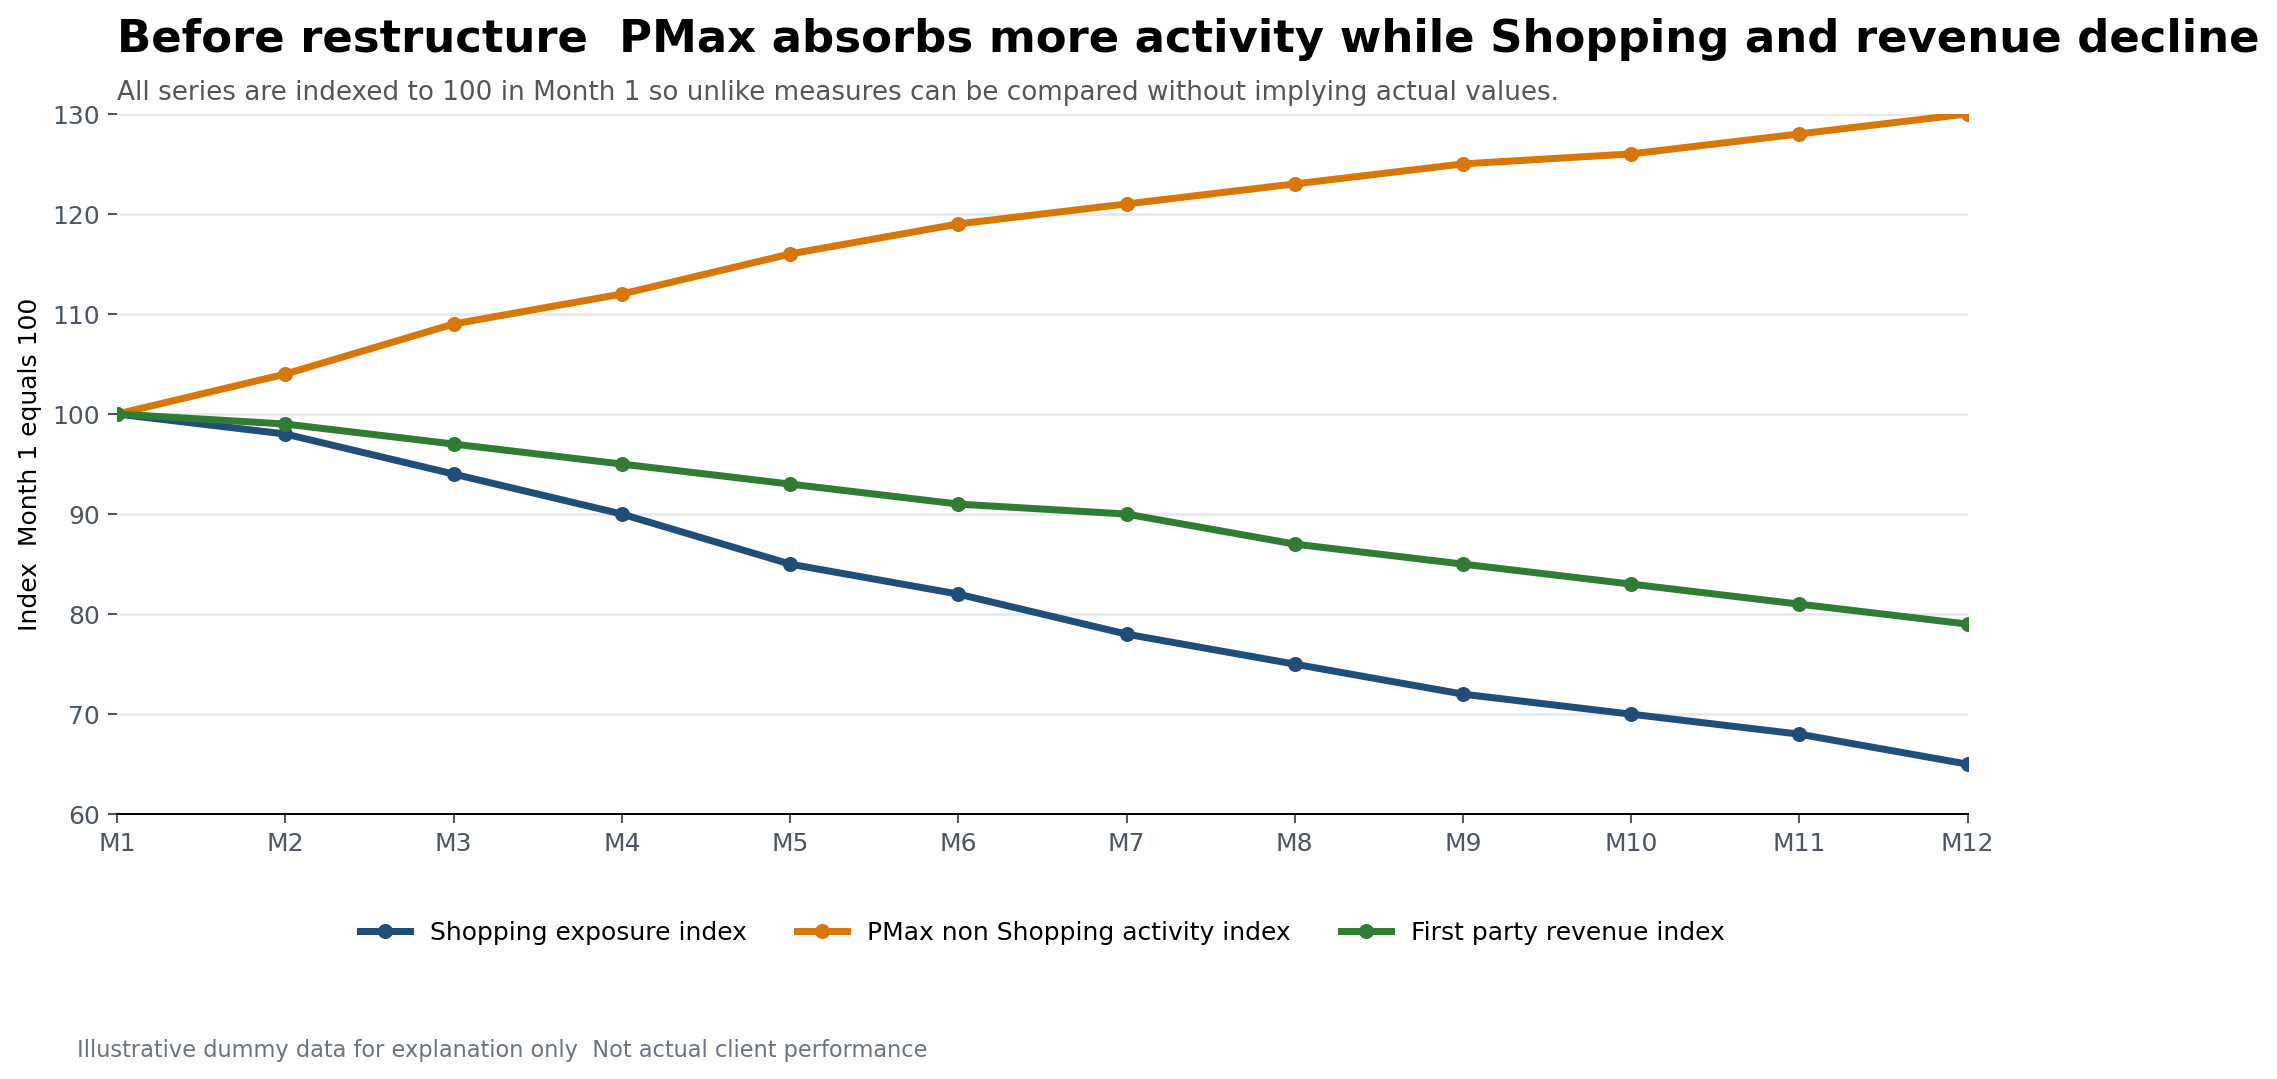
Illustrative model / Months 1–12
Reported strength can hide commercial decline
As PMax shifts exposure away from Shopping, attributed performance can hold up even while first-party revenue softens.
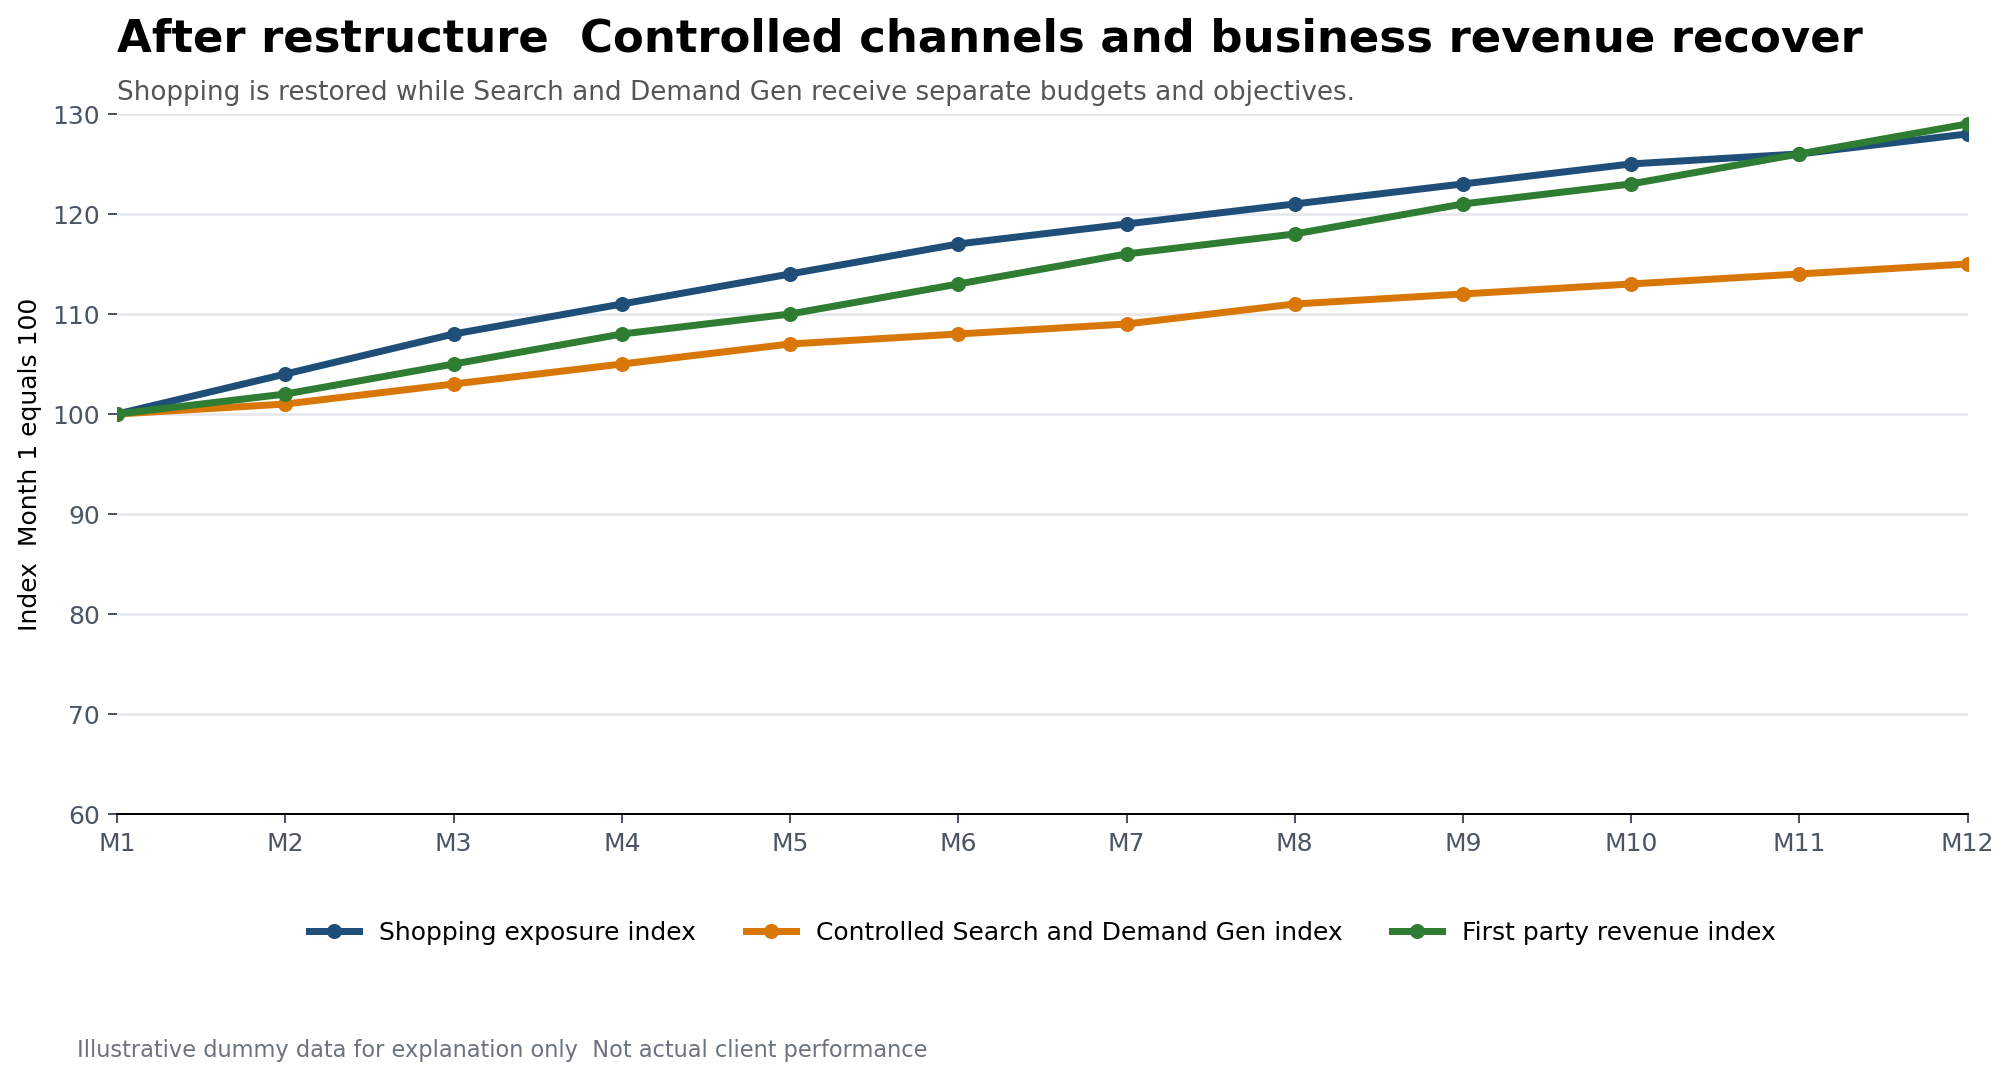
Illustrative model / Months 13–24
Restore channel roles, then judge the business result
Shopping is redeployed for product demand, while Search and Demand Gen receive distinct jobs, budgets and measurement.
A better test than campaign ROAS
Restructure around clear channel roles. Let Shopping handle product-led demand, Search handle deliberate query coverage and Demand Gen handle prospecting or re-engagement with its own budget and creative. Then compare the periods using first-party revenue, new-customer contribution and blended efficiency.
This is not an argument that PMax never works. It is an argument that automation should not be allowed to mark its own homework. When acquisition and demand capture are blended, a strong ROAS can conceal a weaker business.
When platform ROAS rises but revenue falls, believe the business result first. Then use the channel report to find out why.